In 2015, we witnessed the dawn of a new age in publicly-available analytics.
For the first time ever, thanks primarily to Statcast, we were able to measure and analyze new aspects of the game, like exit velocity and spin rate, in ways we never have before.
What I find most curious about this onslaught of new data is that we still aren’t entirely sure what to make of everything. It’s as though we’ve opened a brand new 1000 piece puzzle and can see the picture on the box, but have only just begun to find the corners.
For example, take a look at the exit velocity of Jorge Soler and Anthony Rizzo from last season:
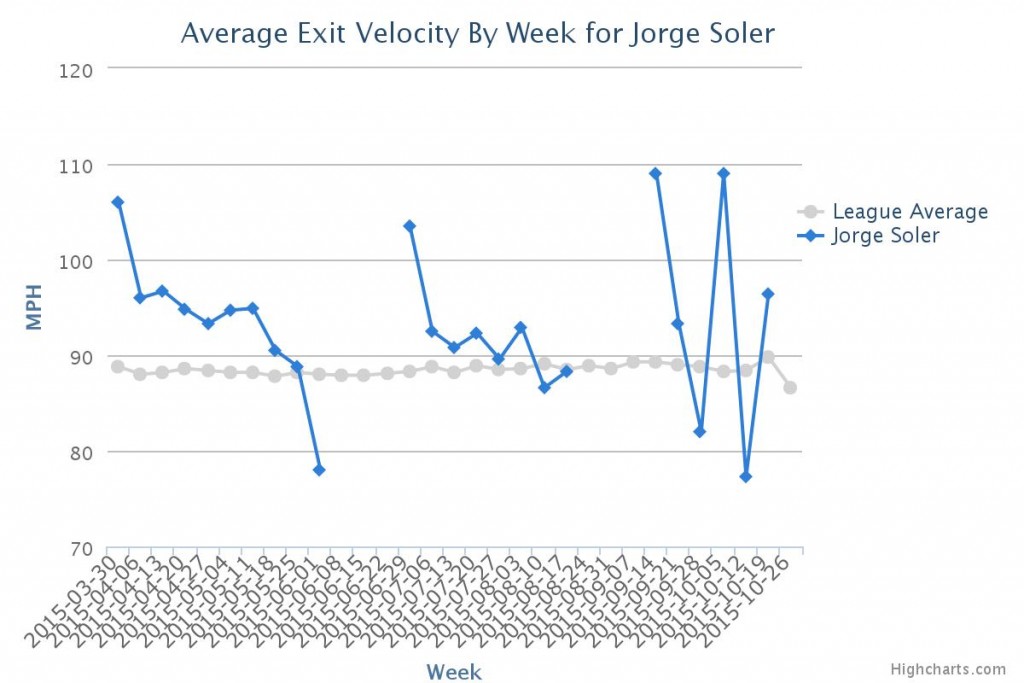
As you can see, Jorge Soler’s average exit velcoity in 2015 falls mostly above average. In fact, he had the 23rd hardest ball last season, leaving with an exit velocity of 116.2 MPH. If Giancarlo Stanton didn’t exist, that would have been the eleventh hardest hit ball in 2015. On average, Jorge Soler falls into the top 30 of exit velocity for all qualified players in 2015. Anthony Rizzo, on the other hand:
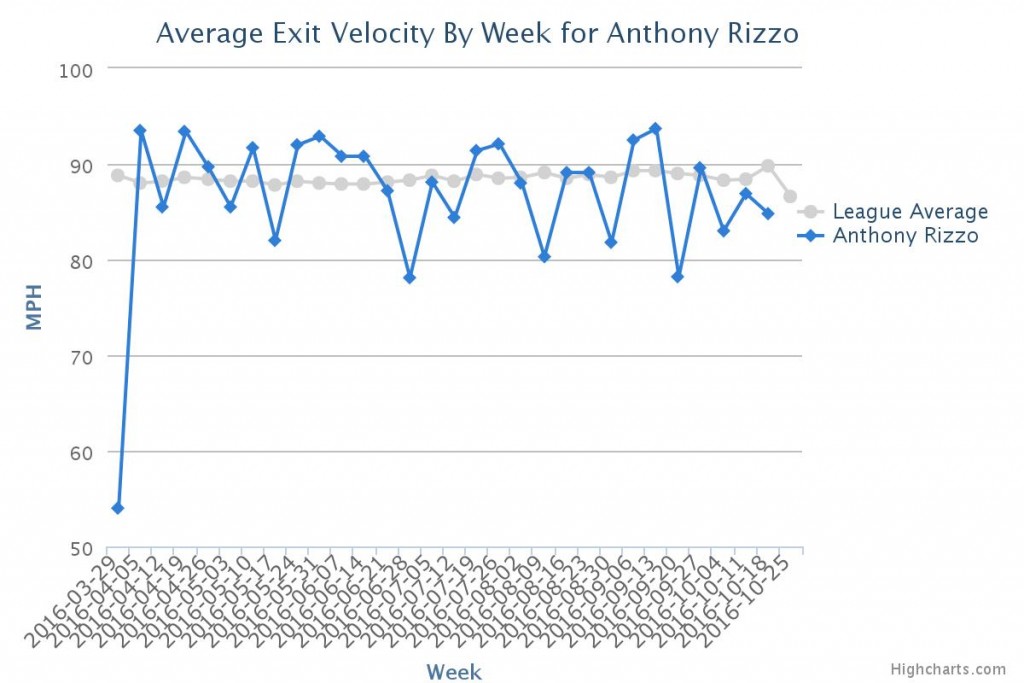
As you can see here, Rizzo actually spends a good amount of time below league average – certainly more than Jorge Soler – and has far lower overall exit velocities. But, as we know, Anthony Rizzo is still an excellent hitter (undoubtedly better than Soler), so there is definitely more to the picture.
[adinserter block=”1″]What I think we’re missing most from examining exit velocity, alone, is the rest of the batted ball data – most of which has been available for years. For example, when comparing exit velocities of two or more different players, you need to know in which direction they hit the ball, was it on the ground/in the air, and their overall breakdown of hard hit vs. medium/soft, etc. Lucky for you, I’ve compiled all of that data below for the primary 2016 Chicago Cubs position players.
Let’s take a look, starting with the type of contact:
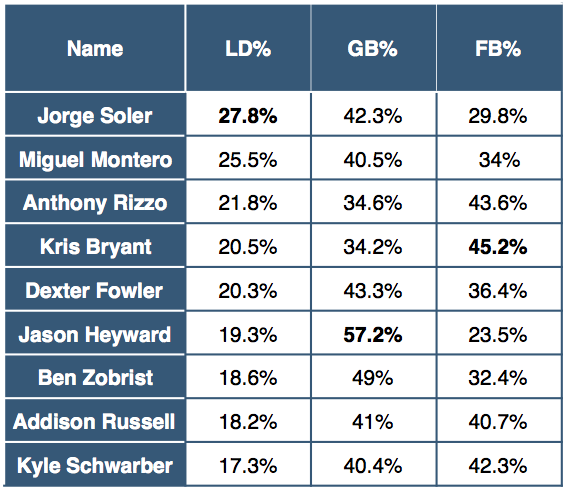
There is so much to examine when looking at the chart above, but I’d like to hit on just a few for now.
First, you shouldn’t be surprised to see Jorge Soler with the lowest fly ball rate. Although he hits plenty of line drives, one of the biggest take aways from last season was that he needed to elevate the ball more often. With the type of exit velocity he usually produces, more elevation will lead to more and more HRs. Ditto Jason Heyward, who had an enormous 57.2% ground ball rate. He’s made his career work despite that number, but just slightly higher elevation would likely lead to a much more productive offensive force.
And then you come to Anthony Rizzo and you start to get a clearer picture. He has the third highest line drive rate (21.8%), the second lowest ground ball rate (34.6%) and the second highest fly ball rate. His overall profile is much better balanced than Soler and that’s at least – in part – the reason for his relative success.
Let’s shift towards directionality:

Directionality is a much more difficult stat to take in isolation. You don’t necessarily want a very large pull rate, because the defense will eventually shift against you and take part of your game away. That said, take a look at Kyle Schwarber. He pulled the ball the most out of that group in 2015, but kept the ball off the ground among the most, as well. As long as he was hitting line drives or fly balls, then, his pull rate allowed him to be productive.
[adinserter block=”2″]And once again, we’re drawn to Jorge Soler. Aside from Miguel Montero, Soler pulled the ball the least last season, going towards center or right field an impressive 61.7% of the time. With such a wide range of potential outcomes, defenses can’t strategically stagger or shift their players with any sort of confidence. It’s also telling of Soler’s ability (and apparently, desire) to go with the pitch, instead of forcing it in a certain direction. [Brett: That said, it’s generally easier to generate maximum power to the pull side, so perhaps Soler could actually stand to pull the ball a bit more. It’s a delicate balance, because you don’t want to take away a guy’s natural all-fields approach – it’s a good thing! – but you do want to maximize power for a guy like Soler, who has a lot of it.]
Lastly, let’s look and hard, medium and soft hit rates:

I like to sort this category from lowest soft hit percentage, and work from there. In that way, you can see who has the highest combined medium and hard hit percentage. Although you may have suspected Jorge Soler, once again, this time it comes down to Kyle Schwarber … the dude pulls the ball, hits in the air, and hits it hard.
[adinserter block=”3″]I’ve already found his 50-1 odds to league the lead in HRs a no-brainer, and this further confirms that suspicion. He might just struggle with lefties or he might struggle the entire season, but what little of what we saw from him in 2015 leads me to believe Schwarber has a huge season ahead of him. It’s no surprise to see Kris Bryant or Jorge Soler fall in just after, because those three guys visually hit the ball hard.
Anthony Rizzo, as we know, has notoriously low hit rates, as evidence by the third highest soft hit percentage on this list. In fact, he also has the lowest hard hit percentage of the entire group. Clearly, there are other ways to be productive and effective, but it’s just not something you might otherwise guess. You should also note (just for your sanity, before the season) that Jason Heyward has the highest soft% and third lowest hard% on the team, yet he, too, slashed an impressive and well-balanced .293/.360/.439 last season.
So, the lesson here today is to make sure to take as many variables into account as you can before making a judgement based, for one example, on exit velocity. While it is an exciting and useful new statistic, it is but one piece of a much bigger puzzle.
[adinserter block=”4″]