
Inspired by TangoTiger’s Building a Better WAR Metric series (which is a good read in its own right), FanGraphs’ August Fagerstrom embarked on a journey to create a WAR metric that improved the way defense is incorporated into the end value.
Specifically, he wanted to try and include a defensive component that smoothed out some of the rough edges by include multiple years of data (rather than just that single year you’re looking at for WAR), and also include some scouting information, so that we could know a player’s “true-talent defensive ability.”
From there, here’s how WAR would be calculated:
“So let’s imagine a world where, last year, every player performed exactly to their true-talent defensive ability. Everyone hit the same, everyone ran the same, everyone had the same amount of playing time, but defensively, we knew exactly what everyone’s true-talent ability was worth, and no one varied from it.”
[adinserter block=”1″]It’s an interesting concept and one you should read up on and dive into the sortable leaderboard while you’re at it. Suffice it to say, no matter which way you cut it, there are several Cubs near the top of whatever WAR leaderboard you choose to sort through.
As for True-Talent WAR (TT_WAR), the Cubs had two players who ranked in the top 10 in 2015 with Kris Bryant (8th) and Anthony Rizzo (10th) and added Jason Heyward (20th) to give them a 2016 nucleus with three top-20 everyday players.
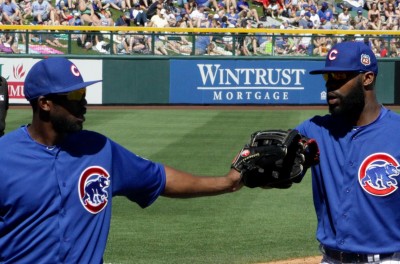
However, the thing that might stand out the most in this exercise is how much value there seems to be in the defensive play of Heyward and shortstop Addison Russell — both of whom will play integral defensive roles in the coming season. And that is evident in how their TT_WAR numbers took a hit.
Heyward has quite the distinction in having the second biggest discrepancy between his 6.0 WAR and 4.7 TT_WAR – losing 1.3 wins in the process. Russell lost 0.9 WAR when comparing his 2015 WAR and TT_WAR. That highlights just how good the two were on defense in 2015, and questions whether they should be expected to be as valuable, based on defense, in 2016.
On the other hand, a player like Dexter Fowler (who lost 1.0 WAR in the exercise) was clearly dinged because of his defensive issues in the field in previous years.
[adinserter block=”2″]As far as this particular WAR metric is concerned, it can go both ways.
Fowler and Russell represented a pair of the biggest discrepancies on the WAR board with Fowler dropping 30 spots down the board and Russell losing 29. As for Heyward, he tumbled nine spots on the WAR leaderboard, which is still significant in its own way, but not as eye-opening as other discrepancies.
Only NLCS agitator Daniel Murphy (down 33 spots) had a bigger drop off from WAR rank to TT_WAR rank than Fowler or Russell.
Then there is Ben Zobrist, whose 2.1 WAR adjusts to 3.0 under TT_WAR, which represents the second biggest rank difference going in a positive direction, climbing 26 spots up the rankings. Only outfielder Gerardo Parra (+51 spots, +2.1 WAR) was helped more by TT_WAR.
Using TT_WAR is far from a perfect way of figuring out a player’s value, but at minimum it advances the conversation and provides more information on display for discussion. For those who have a gripe with the defensive component of WAR, maybe this helps.
And hey: in context, a little extra data never hurt anyone.
Brett Taylor contributed to this post.
[adinserter block=”4″]