
Did you know the Cubs traded for Aroldis Chapman? You may have heard.
The news first broke on Sunday night, and then we tracked it immediately on Monday morning, before it ultimately became increasingly official, and was finally announced by the Cubs yesterday.
The deal is Aroldis Chapman for Gleyber Torres, Adam Warren, Billy McKinney, and Rashad Crawford, and we’ve dug into the prospects in the deal and the difficult non-baseball implications, but there’s other stuff to get to, as well.
Like, say, getting to know Aroldis Chapman, the pitcher. We did it last week when the Cubs brought in lefty Mike Montgomery, and, while you may think you know Chapman’s arm well enough, there’s probably more you can learn.
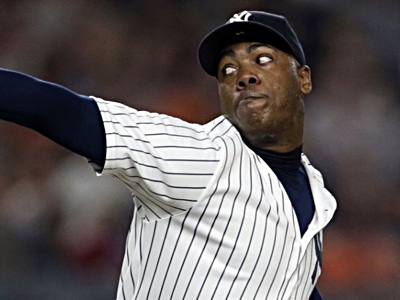
For the most part, I suspect, most Cub fans are aware of the 28-year-old lefty, his 100+ MPH fastball, and his history of utter domination in the Major Leagues. As a former Red, Chapman has frustrated the Cubs many, many times. But I doubt many have taken a closer look into his statistics – especially from this season with the Yankees – so we’re going to do that today, with Chapman set to join the Cubs.
[adinserter block=”1″]
First, let’s start with some of the most obvious stuff. Despite serving a 30-game suspension under the domestic violence policy at the beginning of the season, Chapman has already recorded 20 saves – blowing just one – in his 31.1 innings pitched in 2016. His 2.01 ERA is bested by his 1.93 FIP and confirmed by his 2.38 xFIP. He has a 36.7% strikeout rate, a mere 6.7% walk rate, and has already been worth 1.4 fWAR – that’s great for most relievers over an entire season, let alone 30-ish innings pitched.
Here’s how those stats rank out throughout the rest of the league:
So, yeah, he’s been one of the best relievers in baseball this season. But even though all of his statistics aren’t quite at the very top, we know that he is a dominant reliever – easily one of the very best in baseball – so we might be better served checking some of these numbers against his former self.
Let’s look backwards to 2013, the first season he became the dominant closer we know today:
As you can plainly see, Chapman has been as close to perfect as a reliever can possibly get over the course of a full season for four straight years, but you may also notice some of stats are a bit “worse” in 2016. Most notably, his strikeout rate has dropped from its usual 40.0%+ mark to 36.7%. And while that may give you pause, you should note that 36.7% is still the sixth best strikeout rate in all of baseball and is still more than high enough to continue his streak of dominance. But even if you can’t get over it, the decrease in his strikeout rate has come alongside a near 50% drop in his walk rate. What has typically been above 11.0% (well worse than average) has slipped into the 6-7% range, which is better than average. That tradeoff is what has kept his FIP down under 2.00 and what should keep your excitement way up.
But we can still dig deeper.
[adinserter block=”2″]
With an examination of his plate discipline statistics, it’s fairly easy to see why the strikeouts may have fallen a bit this year. In short, batters are swinging more often at pitches in the zone, while making the same amount of contact, and are swinging at the same amount of pitches out of the zone while making more contact.
O-Swing Rate: -0.1%
Z-Swing Rate: +6.8%
O-Contact Rate: +7.1%
Z-Contact Rate: +0.1%
Now, for the most part, you’d prefer if batters swung at more pitches out of the zone, because that means they’re probably having trouble recognizing your pitches and/or are about to make weak contact if they do connect. But with Chapman, batters are not offering at more pitches out of the zone, but are swinging at pitches in the zone far more often. I don’t want to assume too much, but these numbers would suggest that he’s fooled hitters less in 2016. At the same time, batters have made more contact with those pitches out of the zone (which could be good or bad, we’ll get to that in a second), and the same amount of contact on pitches in the zone.
In short, he’s fooling batters less and missing fewer bats. But even though more contact equals fewer strikeouts, that doesn’t mean he’s been ineffective. In fact, it’s possible that he’s inducing far more weak contact, which can help a pitcher become more efficient and get quicker outs. After all, his statistics aren’t that much worse in 2016.
[adinserter block=”3″]
I’ll admit, I was a bit surprised by Chapman’s batted ball data for the 2016 season. Considering how good he’s been this year, I expected an improvement on hard/soft hit balls, but that doesn’t really seem to be the case. In fact, it’s been about the same as always:
Soft Hit Rate: -0.7%
Medium Hit Rate: +0.6%
Hard Hit Rate: +0.2%
For the most part, those differences are negligible. Chapman has essentially allowed the exact same amount of hard, medium, and soft hit balls as he ever has. I suppose – given the excellent rates he’s posted – that’s not a bad thing. However, it does serve to explain a bit of the decrease in overall production. Chapman has been unable to turn the increased contact with pitches out of the zone into more weak contact. But again, he was already allowing very little hard contact, so a drop in production hasn’t (and probably shouldn’t) happen.
But just in case you still think there might be something strange happening, let’s take a look at his pitch mix and velocity to make sure everything looks as good this year as ever. If you were unaware, Chapman uses his fastball the vast amount of the time, a slider every now and then, and a change-up very, very rarely. But, if it’s fastball velocity you’re worried, about, there’s nothing to fear. Chapman’s average velocity in 2016 (100.0 MPH) is more than half a mile per hour faster than 2015, and over one mile per hour faster than his career average (he also tossed one over 105 MPH earlier this year). Similarly, he hasn’t lost a beat on his slider or change-up, either.
I suppose, then, that the bottom line on Chapman is simple. He looks as good as ever, he’s throwing as hard as ever, and his production has been just about as good as ever. He’s striking out fewer batters than usual thanks to an increase in contact and a bit better pitch recognition than previously, but has counteracted those deficits with a near-50% cut in his walk rate. Being that Chapman changed teams for the 2016 season for the first time in his career, it’s fair to wonder if there was a philosophical change in his approach that yielded these changes. The results are still excellent.
I fully expect Chapman to step into the closer’s role in Chicago and continue dominating as he always has.