 The 2016 version of the Chicago Cubs have an ISO (isolated power) of .173 this season. That number puts them in second place (just head of the 1930 team, and behind the 2004 team) for most all-time by any one Cubs team.
However, with just four games to go, the Cubs’ overall slugging percentage (.429) is outside of the top ten in Cubs’ history, and might struggle to sneak back in before the season is over.
So how then, can the Cubs hitters display as much raw power as ever, but produce much lower slugging percentages than (what should probably be otherwise) expected?
Well, the team’s strikeout rate, and thus depressed batting average (which reduces SLG, but not ISO), plays a big part in that. But is it also possible that their home ballpark was suppressing offense this year much more than usual?
[adinserter block=”1″]
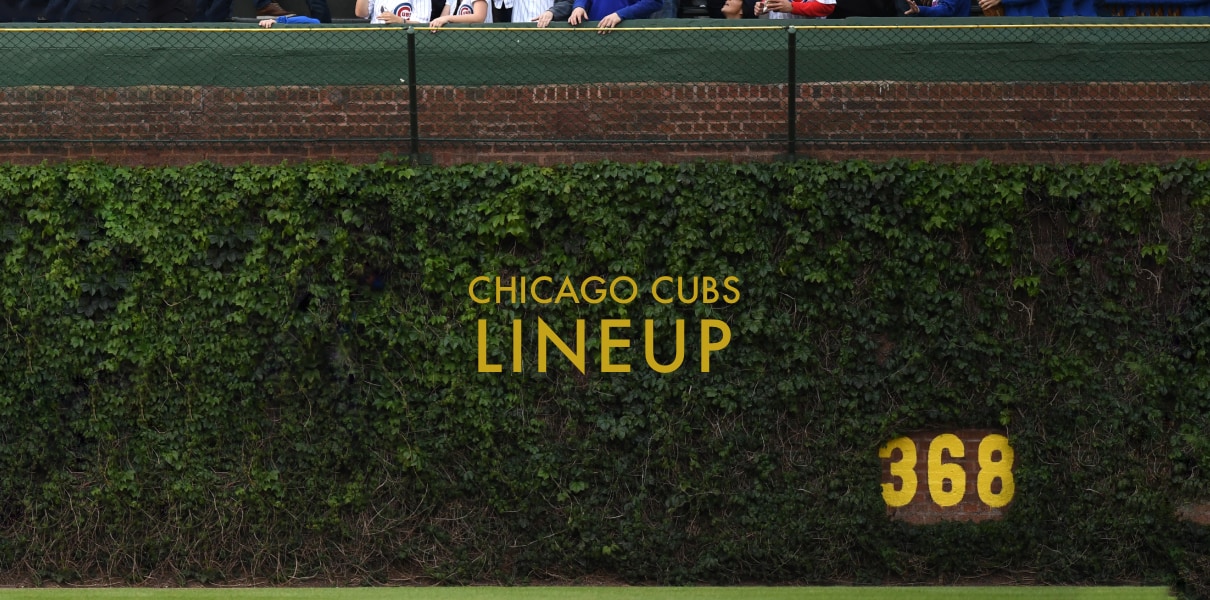
Believe it or not, in 2016, Wrigley Field has ranked among the worst offensive environments (by Park Factor) in the National league.
At FanGraphs, Tony Blengino has updated the 2016 Park Factor scoring, focusing this time on the National League. (For a detailed explanation of how the scores are calculated, the individual ranks, and a short write-up on each stadium, check out Blengino’s accompanying article here. And in case you’re wondering, ball-in-play type and exit velocity are controlled for, so in theory this shouldn’t just be a product of the Cubs’ pitchers being great contact managers, and bringing Wrigley Field’s numbers down.)
As you can imagine, Coors Field in Colorado ranks highest with a park-factor of 124.3 this season, while Wrigley Field is second to last with a score of 89.8. As an example of how these factors play out, consider that while hitters at Coors Field would typically expect to hit .341 and slug .544 on any ball in play (BIP) this year, those numbers have (in actuality) jumped up to .372 and .622. Similarly, while hitters at Wrigley Field would typically expect to hit .318 and slug .521 on BIP this season, they’ve actually hit .301 and slugged .495.
Here’s the rest of the NL rankings in order:
- Coors Field (Rockies)
- Great American Ball Park (Reds)
- Chase Field (Arizona)
- Miller Park (Brewers)
- Petco Park (Padres)
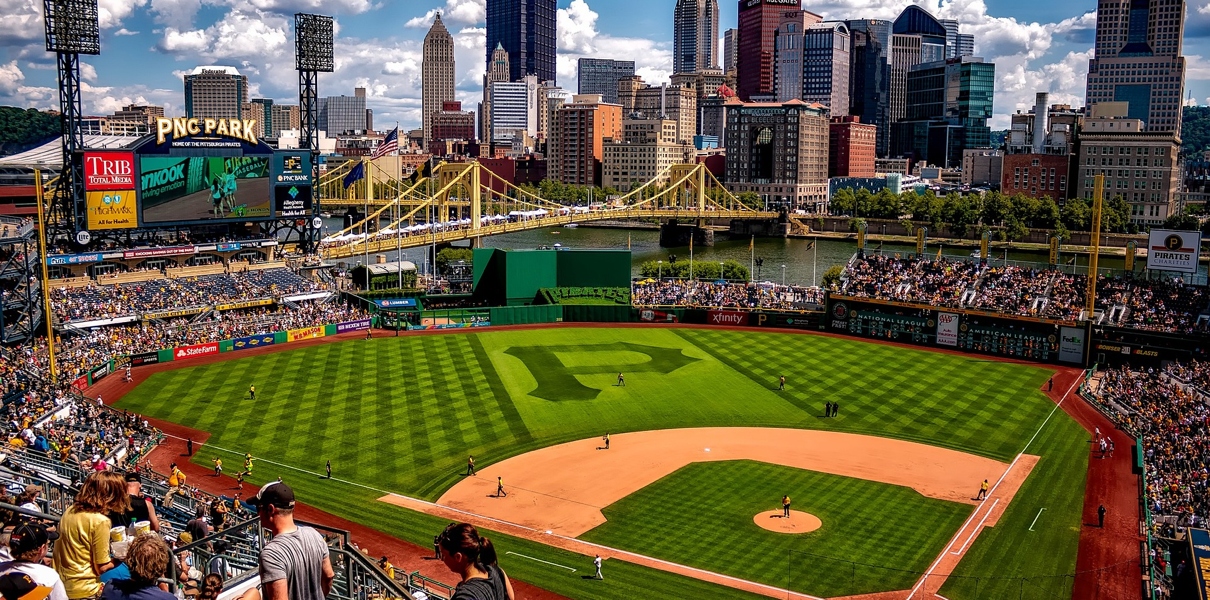
- PNC Park (Pirates)
- Citizens Bank Park (Phillies)
- Marlins Park (Marlins)
- AT&T Park (Giants)
- Citi Field (Mets)
- Dodger Stadium (Dodgers)
- Nationals Park (Nationals)
- Turner Field (Braves)
- Wrigley Field (Cubs)
- Busch Stadium (Cardinals)
[adinserter block=”2″]
According to Blengino, Wrigley Field has still allowed a normal/MLB average number of home runs, given its BIP mix, but has really limited the number of doubles (park-factor of 92) and triples (park-factor of 73) as a whole. “A cold, wet spring,” Blengino theorizes, “also tamped down run production early in the season.” [Brett: I don’t have the data handy, but, anecdotally, I’d add that it sure seems like the wind was blowing in waaaaay more than usual this year. That doesn’t just impact homers, but it can also hang up balls that would have become doubles or triples, or even just hits at all.]
On the one hand, you have to be pretty impressed by what the Cubs hitters – especially Anthony Rizzo (39 doubles, 4 triples), Kris Bryant (33 doubles, 3 triples), and Ben Zobrist (29 doubles, 2 triples) – have done in spite of park factors working against them.
… but, on the other hand, you have to at least acknowledge that these park factors have probably helped the Cubs pitchers quite a bit (especially considering how much they rely on batters putting the ball in play (weakly)).
These park factors change every year, though, and pitchers and hitters can change as well – augmenting their approach to fit the situation. So don’t see this as a way the Cubs have had an advantage or a disadvantage; just be aware when evaluating performance that, in 2016, Wrigley Field hasn’t been all that great a place to hit.
Brett Taylor contributed to this post.
[adinserter block=”3″]