[Ed. – The following is a post from resident genius DocPeterWimsey on the BN Message Board. Recently, we’d discussed the Cubs’ underlying performance and whether it squared with their win-loss record. Doc dug into that discussion from another angle, and his mathematical excursions are always worth a read. The short version? This Cubs season has been pretty damn improbable, and, if it continued in this fashion, it would be *historically* improbable. All stats are as of May 24.]
We had some discussion on the main page about whether the Cubs are doing something really implausible by posting a 0.391 winning percentage. This follows from a couple of summaries of Cub peripheral statistics suggesting that they should be a 0.530 team or better.
Here is the important number: 0.027. That’s the Cubs’ “net” OPS: the offense has an OPS of 0.707 and the Cubs pitching + fielding has allowed an OPS of 0.680.
Let’s say that the Cubs ended the season with a net OPS of 0.027. How should they do? Below are the net OPS of all MLB teams from 1962 – 2012:
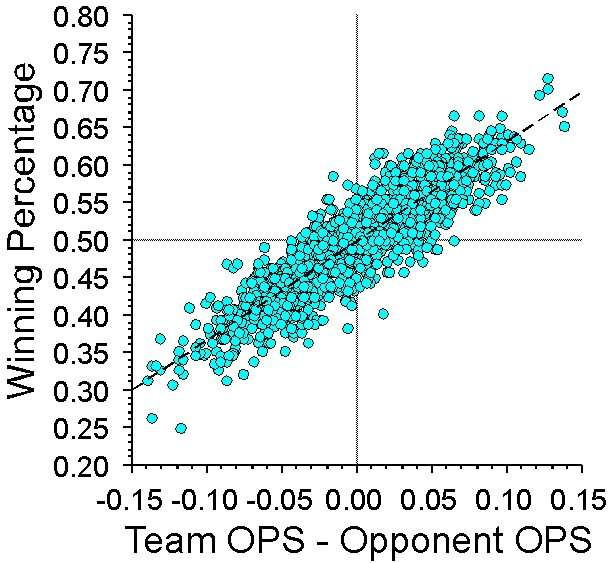
That’s 1338 teams, showing a very tight correlation between the OPS Garnered minus OPS Allowed and winning percentage. (Net OPS correlates tightly with runs scored / allowed, and run differential correlates tightly with winning, so this shouldn’t be a surprise.) Basically, for every 0.01 a team increases it’s Net OPS, you expect 2.14 wins.
So, that means that the Cubs should be on pace to win 87 of 162 games: and with luck, you can make the playoffs with 87 wins. However, the Cubs winning percentage of 0.391 would give them only 63 wins: a whopping 23 below expectations!
But, you say, OPS is only part of winning. (Or, you say, it’s a made-up stat because your Topps cards didn’t have it in 1972.) With a bit a bad managing, non-clutch hitting, pitching and fielding, and this can happen. All we need to do is compare the Cubs to other teams that missed by so much …
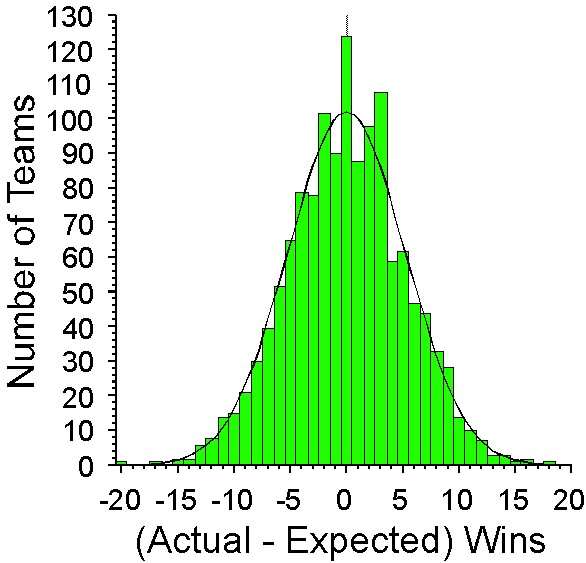
… except that there aren’t any. This shows the difference in actual and expected wins, with “actual” based on winning percentage x 162. (Sometimes teams play 161 or 163 games, so this standardizes for that.) Net OPS actually explains 80% of the variation in winning percentage, so we actually didn’t have much room for many teams on pace for 26 over/under expectations. Indeed, 50% of teams win within 3.5 games (one way or the other) of expectations. Only one team, the 1994 Padres, had a winning percentage so far off that they would lose 20 games: but because 1994 was the strike year, they were on pace to lose 20 more games than you’d expect given their net OPS. (I wish them many more, as I still hate them for defying odds in the other direction 10 years earlier.) So, the Padres had a record over 0.100 under expected after 117 games, not after 162 games: and had they regressed to their mean (0.500), then they would have come in at about 15 or 16 under.
The biggest “underachievers” over 162 games are the 1965 Red Sox, who managed 17 fewer wins than expected, and two other teams (1962 Mets and 1993 Mets) managed 15 fewer wins than expected.
Now, will the Cubs keep this up? Almost certainly not. Let’s just say that the Cubs keep playing +0.027 OPS ball. There have been 118 teams in the last 51 years that finished with net OPS between 0.022 and 0.032 (i.e., with 0.01 of the Cubs). Only 11 of these teams finished with records under 0.500. Three more finished at 0.500: which is where the Cubs will finish if they “regress” to the expecation for a +0.027 OPS team.
Of course, the other reason why this won’t happen is that if the Cubs aren’t a 0.500 team in July, then there is going to be a sell-off: and the remaining team won’t be a +0.027 OPS team (probably). As we don’t expect the Cubs to crawl back to 0.500 until the very end of the season, this seems assured!
However, when we start asking “why,” then we probably should exclude answers that would apply to whole teams over an entire season. For example, there have been a lot of really bad managers over the last 51 years: but nobody has managed their team to 23 wins under expectations. There is the “clutch” aspect: and, of course, as “clutch” over any stretch of games fails to predict “clutch” over the next stretch, this suggests that the bad luck (especially when it comes to slugging with men on base) can’t continue. (I mean, it can’t, can it?!?!?)
And, of course, we have to wonder if this isn’t a small blessing in disguise. Is this really a +0.027 team? Are Wood and Feldman really pitching as well as their OPS Permitted suggests? Is Valbuena going to keep hitting like this? An 86 or 87 win team is just tantalizing enough to “go for it”: but it’s probably not going to make it, especially in this year’s NL Central.
However, that’s food for another discussion.