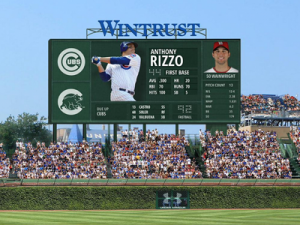
 There was a great deal of discussion and debate over the need for a JumboTron (or “video board,” if you prefer) in Wrigley Field before the Ricketts family planted one in each of left and right field this past offseason. Most of that debate revolved around tradition and aesthetics, but in my mind, most fans have come to terms with the new, rather large boards, while many others (like me) would even say they’ve become a very welcomed addition.
While most of the discussion circulated alongside how the boards would fit in at Wrigley, just a few discussed the potential impact they would have on the game itself. That is, Wrigley is notorious for being particularly susceptible to fluctuations in the wind pattern. With two large structures placed in both sides of the outfield, it was not out of the question to wonder what effect they may have on balls hit in the air. Given that this is just the first season with the boards in place, we haven’t had much of a sample size to test that question, until now.
Over at Hardball Times, David Kagan shares an interesting take on how the newly-installed video boards are affecting the games at Wrigley Field.
In his first attempt to describe the change elevated balls have been experiencing this year due to the video boards in the outfield, Kagan takes a look at wind direction, intensity and frequency. In other words, he looked to see where the wind was blowing from/to, how fast it was blowing and how often it blew from that direction. What he found, though, was less revealing than he hoped.
Perhaps counterintuitively, the average wind speed at Wrigley Field in 2015 (11 mph) is actually up from its average in 2014 (8 MPH), but the range (2 MPH-24 MPH) and standard deviation (5 MPH) in 2015 are nearly identical (1 MPH-23 MPH) and (4 MPH) in 2014. And most interestingly, the wind direction was just as erratic and unpredictable as ever. His conclusion, then, was that the winds at Wrigley are so variable that it is too difficult to distinguish the effects of the remodel from weather data alone.
In order to explore the topic further, Kagan turned to physics. By estimating the height the scoreboard towers above ground level (80 ft) compared to the height of the bleachers above ground level previously (33 ft), Kagan uses a trajectory calculator to address how far a ball may fly with the wind blowing in, blowing out or remaining neutral.
Comparing different exit velocities and trajectories, Kagan is able to estimate the impact the left field board (which is much bigger than right field) will have on different types of well-struck balls. Although the conclusion is less than concrete, he does surmise that there is a maximum effect of about a 10 foot change in batted ball distance – that is not insignificant.
There is so much more discussion and explanation in Kagan’s article, so I encourage you to check it out. Although Kagan leads us to some interesting conclusions, he reminds us that they are only preliminary. Without a larger sample size from which to draw, these figures are just are best guesses, but for now, they are extremely interesting to uncover.