Well, there’s no Cubs baseball today, so you know it’s time for an off-day check-in.
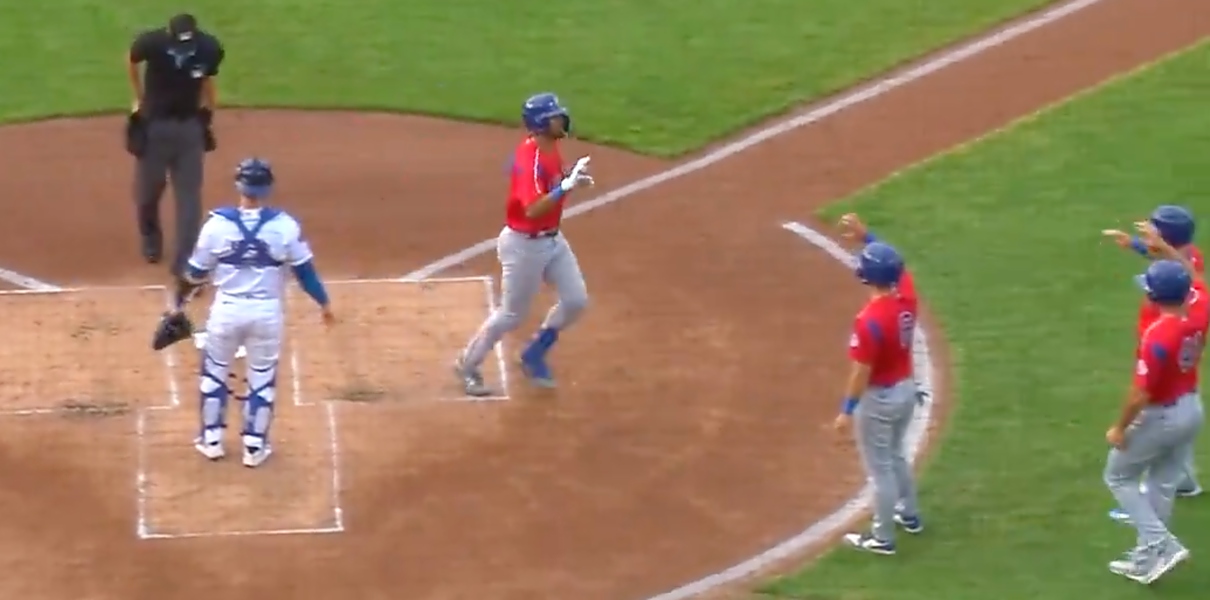
It’s been only 11 days since our last check-in, and the Cubs have done acceptably, beating the White Sox in three (2-1) to kick things off, before dropping two of three to the Braves (1-2), and taking three of four from the Reds (3-1). All together, they went 6-4 over their past ten games, which arguably isn’t great given that seven came against the White Sox and Reds, but it’s definitely far from terrible. It’s borderline good, even.
The Cubs have even moved up in the world, from fourth place last time to tied for second place today:
- Milwaukee Brewers: 28-19 (.596)
- Chicago Cubs: 25-19 (.568)
- St. Louis Cardinals: 25-19 (.568)
- Pittsburgh Pirates: 26-20 (.565)
- Cincinnati Reds: 16-32 (.333)
Of course, the NL Central is still a mess, largely because of an uneven number of games played across the five teams. For example, the “second-place” Cubs have the same number of losses as the Brewers, but three fewer wins. Meanwhile, they have fewer wins than the “fourth-place” Pirates, but also one fewer loss. It’s just very jumbled and very close right now. Also, the Reds exist.
For the second check-in in a row, the Cubs’ run differential has skyrocketed:
- Houston Astros: +98
- New York Yankees: +76
- Boston Red Sox: +75
- Chicago Cubs: +72
- Atlanta Braves: +65
- Philadelphia Phillies: +35
- St. Louis Cardinals: +27
- Arizona Diamondbacks: +34
- Washington Nationals: +26
- Pittsburgh Pirates: +24
Sure, the Pirates and Cardinals are in the top ten, but the Cubs’ differential is nearly three times the Cardinals’ mark and exactly three times the Pirates. So … it’s not the same. They’re not close, and the Cubs are the highwater mark in the NL.
As for splitting the runs scored and allowed, the Cubs’ 5.39 runs scored per game ranks third in Major League Baseball, behind only the Yankees (5.77) and the Braves (5.40).
And get this: the Cubs’ 3.75 runs allowed per game ranks fourth best in baseball, behind only the Astros, Diamondbacks, and Brewers. That’s down from 3.97 runs allowed per game last time.
So where does that leave their expected records? Well, according to two different measures, the Cubs should actually have as many as FOUR(!) more wins than they do:
The Pythagorean and BaseRuns records are a way to measure how many games a team should have won over a given stretch based on the number of runs score and allowed (Pythagorean) and other underlying metrics (BaseRuns). Obviously, teams frequently under and over-perform these numbers, but they are usually a pretty good indication of how well a team may do going forward over a long enough horizon.
While you hate the bad sequencing of runs scored and allowed, it’s hard to be too disappointed with where the Cubs are. At this point in the season, it’s better that they’re tied for second with peripherals that suggest they’ll be much better going forward than in first with peripherals suggesting they’re actually horrible.
And just for some added reference, the Adjusted Standings at Baseball Prospectus (based on different layers of underlying performance), have the Cubs winning something between 27.4 games and 29.2 games. That’s three different ways of measuring where they should be, and all three think the Cubs have a worse record than their performance.
As for the rest of the season … FanGraphs is projecting the Cubs to go 67-51 the rest of the way, which is tops in the National League and would leave them with a 92-70 record by the end of the year (again, fourth best in MLB and best in the National League).
Chicago Cubs Playoff Odds (FanGraphs)
According to FanGraphs, the Cubs improved their position over the past ten games, but only slightly (not surprising, given the jumbled mess at the top of the NL Central). Still, you don’t hate near-90% playoff odds in May.
Baseball Prospectus has odds, too, and they’re on the upswing, as well:
Chicago Cubs Playoff Odds (Baseball Prospectus):
Although the Cubs’ chances of winning their division are still under 50% (grumble), the Brewers (23.5%) and Cardinals (23.1%) odds are half that. As far as I’m concerned, the Cubs are still in the driver’s seat. Moving on.
Chicago Cubs Offensive Statistics (Ranking Today, Previous)
Walk Rate: 9.6% (6th, 20th)
Strikeout Rate: 20.6% (8th, 9th)
ISO: .173 (6th, 8th)
AVG: .259 (6th, 10th)
OBP: .341 (2nd, 8th)
SLG: .432 (4th, 5th)
wOBA: .334 (T-3rd, 6th)
wRC+: 108 (4th, 7th)
Position Player War: 10.8 (1st, 4th,)
Guess what the Cubs have done a lot of lately? Walk. Their walk rate has improved to 9.6% this season, which, alongside a rise in their batting average, has improved their on base-percentage to nearly the best in baseball (Yankees lead with .342). Together, then, the Cubs’ production is EASILY among the top five in baseball, and when you include the rest (defense, base running, etc.), the Cubs have the most position player WAR in baseball – nearly a full win better than the second place Braves (9.9).
Chicago Cubs Pitching Statistics
ERA: 3.28 (2nd, 4th)
FIP: 4.14 (18th, 19th)
xFIP: 4.17 (18th, 20th)
K-rate: 23.1% (14th, 18th)
BB-rate: 11.4% (T-30th, 28th)
K/BB: 2.03 (28th, 29th)
AVG: .225 (2nd, 5th)
GB-rate: 41.1% (1st, 1st)
Soft-Contact: 20.0% (7th, 5th)
Hard-Contact: 31.6 (5th, 4th)
Pitching Staff WAR: 2.9 (22nd, 22nd)
Although it’s not as impressive as the batters, the pitching staff has made some improvements over the past ten days. Their biggest problem remains their walk rate, but thanks to a ton of weak contact and even more ground balls, they’ve brought their ERA to the lowest mark in the National League.
Up Next: The Cubs are playing host to the Cleveland Indians for a two-game set, followed by another off-day. Then they’ll host the Giants at Wrigley Field, before heading to the east coast to tackle the Pirates and Mets. None of these will be easy series, so buckle up.